Sportpersons of World
The following table enlists the popular sportsperson (of the World) −
| Name | Sports | Country | Photograph |
|---|---|---|---|
| Cristiano Ronaldo | Soccer | Portugal | 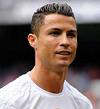 |
| Lionel Messi | Soccer | Argentina | 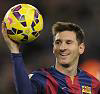 |
| LeBron James | Basketball | USA | 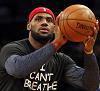 |
| Roger Federer | Tennis | Switzerland | 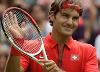 |
| Kevin Durant | Basketball | USA | 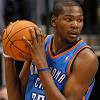 |
| Novak Djokovic | Tennis | Serbia | 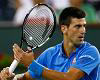 |
| Cam Newton | American football | USA |  |
| Phil Mickelson | Golf | USA | 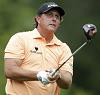 |
| Jordan Spieth | Golf | USA | 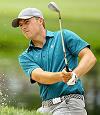 |
| Kobe Bean Bryant | Basketball | USA |  |
| Lewis Hamilton | Formula One racing | United Kingdom | 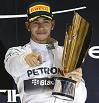 |
| Tiger Woods | Golf | USA | 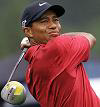 |
| Rafael Nadal | Tennis | Spain | 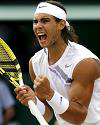 |
| Manny Pacquiao | Boxer | Philippines |  |
| Serena Williams | Tennis | USA | 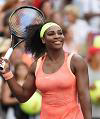 |
| Maria Sharapova | Tennis | Russian | 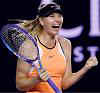 |
| Caroline Wozniacki | Tennis | Denmark | 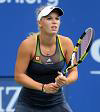 |
| Danica Sue Patrick | Car racing | USA |  |
| Stacy Lewis | Golf | USA | 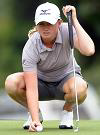 |
| Usain Bolt | Runner (100 m) | Jamaica | 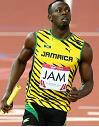 |
| Florence Griffith-Joyner | Runner (100 m) | USA | 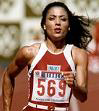 |
Greatest Sportsmen (India)
The following table enlists the greast sportsmen (of India) −
| Name | Sports | Country | Photograph |
|---|---|---|---|
| Sachin Tendulkar | Cricket | Maharashtra | 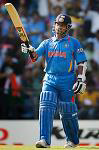 |
| Dhyan Chand | Hockey | Uttar Pradesh | 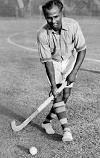 |
| Abhinav Bindra | Shooting | Uttarakhand |  |
| Milkha Singh | Runner | Chandigarh | 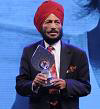 |
| Kapil Dev | Cricket | Chandigarh | 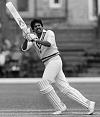 |
| Sushil Kumar | Freestyle Wrestler | Delhi | 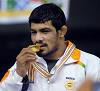 |
| Mahendra Singh Dhoni | Cricket | Jharkhand | 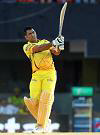 |
| Viswanathan Anand | Chess | Tamil Nadu | 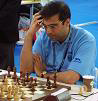 |
| Leander Paes | Tennis | West Bengal | 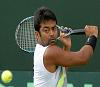 |
| Prakash Padukone | Badminton | Karnataka | 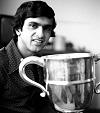 |
| Geet Sethi | Billiards & Snooker | Delhi |  |
| Mahesh Bhupathi | Tennis | Tamil Nadu |  |
| Pankaj Advani | Billiards & Snooker | Maharashtra |  |
| Vikas Gowda | Discus throw | Karnataka | 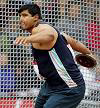 |
| Saurav Ghosal | Squash | West Bengal | 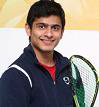 |
| Dhanraj Pillay | Hockey | Maharashtra | 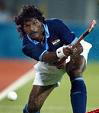 |
| Jeev Milkha Singh | Golf | Chandigarh |  |
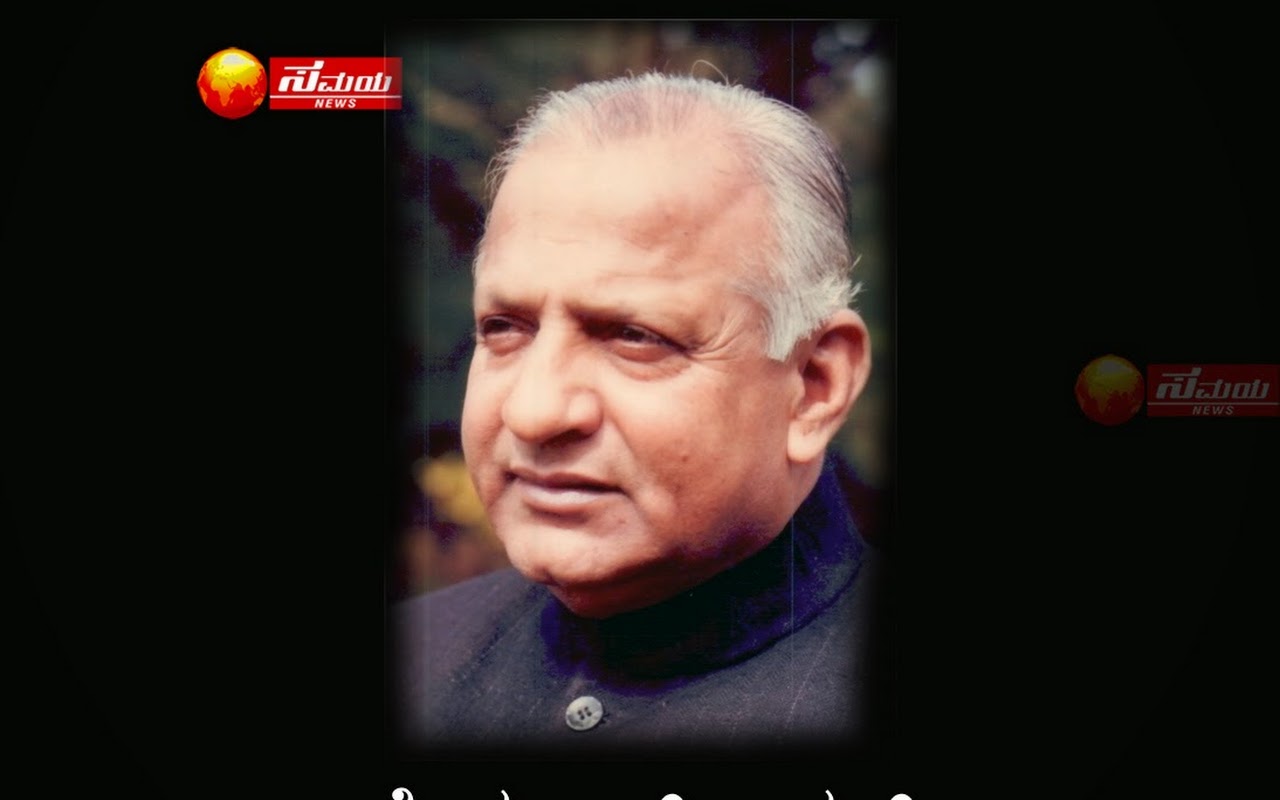
| Balbir Singh Sr. | Hockey | Punjab | 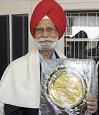 |
| Sunil Gavaskar | Cricket | Maharashtra | 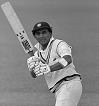 |
Greatest Sportswomen (India)
The following table enlists the greast sportswomen (of India) −
| Name | Sports | Country | Photograph |
|---|---|---|---|
| Deepika Kumari | Archery | Jharkhand | 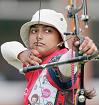 |
| PT Usha | Runner | Kerala | 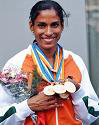 |
| Anjum Chopra | Cricket | New Delhi | 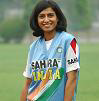 |
| Anju Bobby George | Athletics | Kerala | 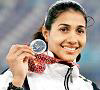 |
| Dipika Pallikal | Squash | Tamil Nadu | 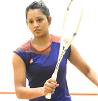 |
| Karnam Malleswari | Weightlifting | Andhra Pradesh | 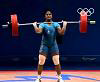 |
| Mithali Raj (Lady Sachin) | Cricket | Rajasthan | 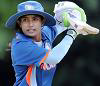 |
| Sania Mirza | Tennis | Maharashtra | 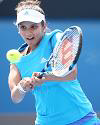 |
| Saina Nehwal | Badminton | Haryana |  |
| MC Mary Kom | Boxing | Manipur | 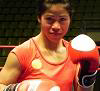 |